
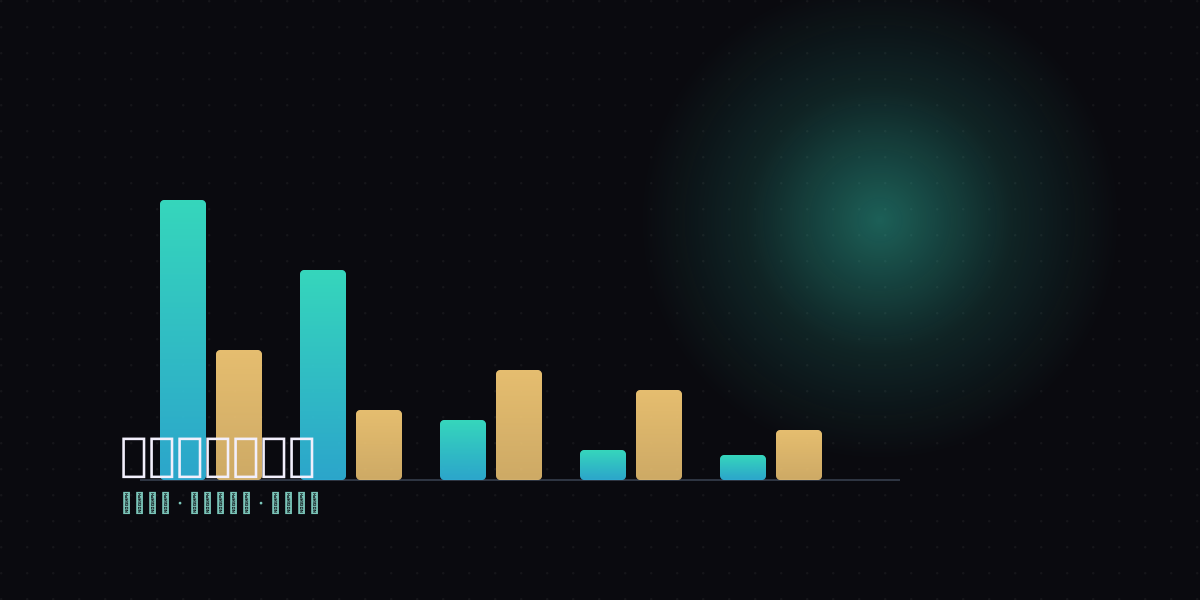
This update's data check
- ✓Source: DefiLlama's public stablecoins API (stablecoins.llama.fi), not self-reported figures
- ✓Retrieved: 2026-08-23 13:34 (UTC+8) — the numbers below are a snapshot at that moment
- ✓Methodology: supply is each chain's live contract balance; weekly change compares against the same API's reading 7 days prior
- ✓This page has a permanent URL and is maintained long-term — every update replaces the numbers and rewrites the interpretation section, it is not a dated snapshot
1. USDT supply by chain (this snapshot)
Total USDT circulating supply is approximately $183.2 billion, still the largest stablecoin by market cap. Below are the top 8 chains by current supply, with 7-day change:
| Chain | Current Supply | 7d Change |
|---|---|---|
| Tron | $91.47B | +0.94% |
| Ethereum | $73.51B | -0.82% |
| BSC | $9.18B | -0.00% |
| Solana | $2.79B | -3.79% |
| Aptos | $0.98B | -0.00% |
| Arbitrum | $0.85B | +1.60% |
| Polygon | $0.81B | -3.21% |
| Plasma | $0.76B | +16.98% |
2. USDC supply by chain (this snapshot)
Total USDC circulating supply is approximately $73.6 billion. Compared with USDT, which is heavily concentrated on just Tron and Ethereum (over 90% combined), USDC's chain distribution is noticeably more spread out:
| Chain | Current Supply | 7d Change |
|---|---|---|
| Ethereum | $46.47B | +0.41% |
| Solana | $7.22B | +7.66% |
| Hyperliquid L1 | $6.69B | +10.69% |
| Base | $4.30B | +2.65% |
| Arbitrum | $2.22B | -1.37% |
| Polygon | $1.66B | +3.25% |
| BSC | $1.58B | +0.01% |
| Avalanche | $0.41B | -2.58% |
3. Three moves worth flagging this period
USDC on Hyperliquid L1 posted the fastest weekly growth on this list (+10.69%). Hyperliquid is an application chain built specifically for perpetuals trading, so fast USDC growth there tends to track margin capital flowing in rather than routine transfers — that correlates more with "more traders opening perp positions on this chain" than with generic demand. Worth tracking in the next few updates to see whether this pace holds or was a one-week outlier.
Solana's USDC (+7.66%) and USDT (-3.79%) moved in opposite directions. When two stablecoins on the same chain diverge like this, the more likely explanation is on-chain swapping from USDT into USDC, rather than net capital flowing in or out of Solana as a whole. Confirming this needs next period's data cross-checked against Solana's total value locked — we're logging the observation here without concluding yet.
USDT on Plasma grew 16.98% in a single week — the largest percentage move on this list. Plasma is a newer chain with a still-small base ($0.76B), and small bases naturally produce large percentage swings that aren't directly comparable to single-digit moves on Tron or Ethereum's much larger balances. But sustained double-digit growth across several updates would be a real signal that the chain is genuinely attracting capital — worth keeping as a comparison baseline for future reports.
4. Update cadence and historical data
This report has no fixed update schedule; we typically re-check every 1-2 weeks depending on how much has moved and available bandwidth. Each update replaces the table with the latest snapshot rather than stacking historical versions on this page — if you need a number from an earlier period, check the page's article:modified_time metadata to judge freshness of the current data, or email us to ask about a specific past date.