
1. Why tokenomics deserves its own deep dive
When the first article in this series laid out the research framework, tokenomics was just one item among many — alongside information sources, project fundamentals, technical ecosystem, on-chain data, and risk checklists — so it only got a short treatment. But once you dig deeper, tokenomics turns out to be one of the areas most likely to be misread from surface-level numbers alone, and one of the areas that most needs cross-verification. Unlike technical documentation, there's no code you can check directly; unlike active on-chain addresses, it isn't immediately obvious at a glance. It's more like a carefully written "design document" — the allocation ratios, vesting schedules, and burn mechanisms a project writes into its whitepaper are essentially a designed arrangement for future supply and demand. There can be a gap between that designed arrangement and what actually gets executed, and that gap itself is something researchers should keep observing over time.
More importantly, tokenomics isn't an isolated topic — it's tightly linked to on-chain data analysis and fund-flow observation. The holder-address distribution, exchange inflows/outflows, and stablecoin supply changes covered in earlier articles are often exactly the tools used to verify whether tokenomics disclosures are accurate. In other words, tokenomics describes "what the documentation says," while on-chain data provides evidence of "what actually happened on-chain." Only by comparing the two can you form a reasonably complete research judgment. That's why this article pulls the topic out on its own: it's both an independent knowledge area and a practical exercise in applying the methodology from earlier articles.
One note up front: everything discussed here stays at the level of research methodology. It does not pass judgment on any specific token or project, does not touch on the timing of any buy or sell decision, and is not investment advice. Readers should combine multiple sources, analyze independently, and take responsibility for their own decisions.
2. Three key supply-side numbers: max supply, circulating supply, and FDV
Researching a token's supply structure usually starts with three basic numbers, each answering a different question: how much exists now, how much could ever exist, and what the theoretical total size is at the current unit price. These three numbers are often displayed side by side on data dashboards, but their meanings and calculation bases differ — mixing them up can lead to completely different size judgments about the same project.
2.1 What max supply and circulating supply each represent
The first is max supply, the hard cap on token supply set by the protocol's rules or contract code — once this number is reached, no more tokens will be issued. Not every token has a hard cap; projects without one typically disclose only the total supply already minted so far. These two concepts shouldn't be conflated: the former is an upper-bound constraint, while the latter is a snapshot of the current stock that keeps growing over time. The second is circulating supply, the amount of tokens currently in the market and no longer subject to lock-up contracts — generally equal to total supply minus team lock-ups, unreleased foundation holdings, investor allocations not yet vested, and portions already counted in total supply but still held, undistributed, by protocol treasury or ecosystem fund addresses. It's worth noting that circulating supply only tells you these tokens are technically unlocked and free of contract restrictions — it does not mean they are evenly spread across a large number of independent addresses. Tokens that are technically unlocked can still be highly concentrated in the hands of early investors or market makers, a point we return to in Section 3 when discussing the pitfalls of allocation concentration.
2.2 How Fully Diluted Valuation (FDV) is calculated
Fully Diluted Valuation (FDV) represents the theoretical total size a token would reach if every token were in circulation, priced at the current unit price. The calculation basis matters here: the standard industry approach is to compute FDV as "current price × max supply," which applies to tokens with a defined supply cap. Only when a token has no hard cap at all (Ethereum, for example) does the industry fall back to "current price × total supply" as an approximation. These are two different bases meant for two different categories of tokens — not two interchangeable formulas for the same token. If a token has both a clearly defined max supply and a lower total supply, using total supply to calculate FDV produces a number that is both understated and inconsistent with standard industry practice, which can be misleading when comparing across projects. The "market cap" figure commonly cited in everyday discussion usually refers to "circulating market cap" — that is, "current price × circulating supply" — which only reflects the portion of tokens already in the market, a different basis from the theoretical full-supply size that FDV reflects. When a project's circulating supply is a small fraction of its max supply, circulating market cap may look modest while FDV can be several times, even dozens of times, larger. Whenever researchers look at any data dashboard, they should note which basis each of these two numbers corresponds to — a lot of confusion stems from conflating "circulating market cap" and "FDV" without distinction. It's also worth confirming that different data sources use the same basis when comparing multiple projects side by side, to avoid drawing the wrong conclusions about relative size due to inconsistent methodology.
3. How to read token allocation structure
The three supply-side numbers answer "how much exists in total, how much can circulate now"; allocation structure answers "what rules were used to divide these tokens among different groups at the start." This step also calls for careful reading, because the allocation ratios are just a plan — and as discussed below, there can be a gap between the plan and tokens' actual holding status.
3.1 Common allocation categories
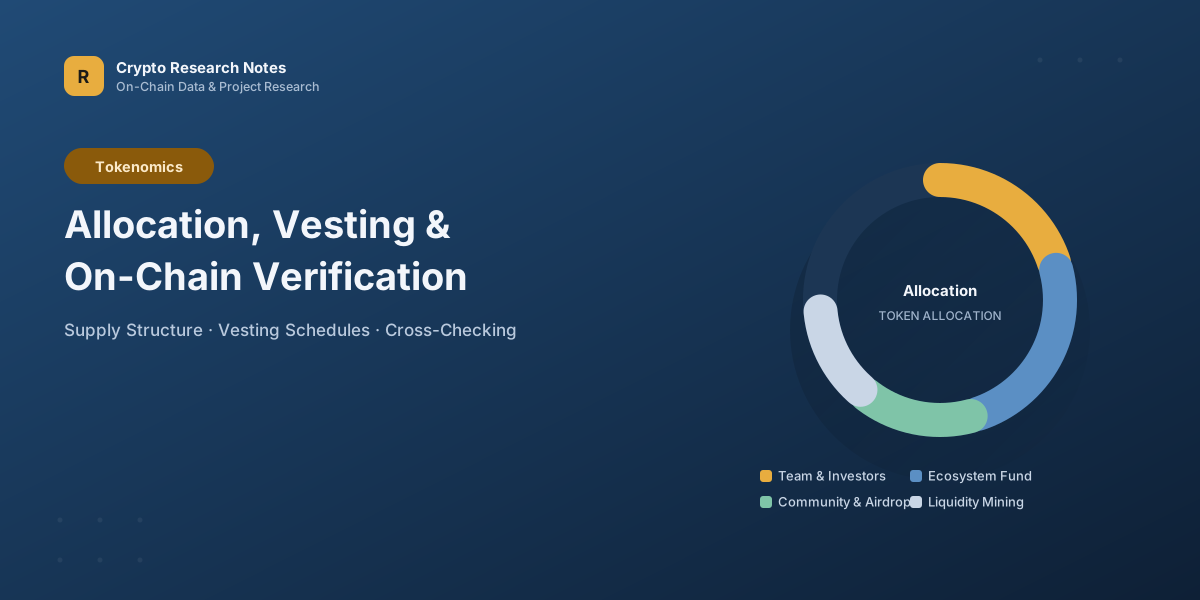
Whitepapers or tokenomics documents usually present an allocation pie chart that splits the max supply into several categories, commonly including:
- Team and advisors: the share allocated to the core development team and project advisors, usually with a long lock-up period.
- Early investors: shares acquired by seed-round and private-round participants, typically at a lower price than the public sale, also subject to lock-up terms.
- Ecosystem foundation / ecosystem fund: held by a foundation or dedicated entity, used for ongoing ecosystem building, developer incentives, and partnership expansion.
- Community and airdrops: shares distributed to early users and community contributors, often emphasized as part of a project's "decentralization narrative."
- Liquidity mining / staking rewards: an ongoing release allocated to incentivize users who provide liquidity or participate in network staking.
3.2 The common pitfall of a "high community share"
Researchers should watch for a common pitfall: when the "community" or "ecosystem" category on an allocation pie chart looks large, it's easy to read that as "widely distributed, highly decentralized." But that number only reflects the allocation plan — it doesn't reflect how concentrated actual token holdings are. Part of a "community" allocation may flow, through a large airdrop, into a very small number of addresses; or an "ecosystem fund" may in practice be controlled by a small number of multisig wallets tied to the team, presented externally as "non-team holdings" even though decision-making power and actual control may be fairly concentrated. For example, if airdrop rules allow bulk claiming or lack effective Sybil resistance (preventing a single entity from posing as many separate users), an allocation nominally spread across "tens of thousands of community addresses" could in practice be consolidated by a handful of script operators into a few dozen wallets — the on-chain ranking of top holder addresses often reveals this kind of gap. Judging whether an allocation is genuinely dispersed takes more than reading a pie chart; it has to be cross-checked against the on-chain holder distribution discussed below. This is one more reason this article keeps stressing that "documentation" and "on-chain evidence" need to be read side by side.
4. Vesting and release schedules
4.1 Linear vesting versus cliff unlocks
After tokens are allocated to groups like the team or investors, they usually aren't paid out all at once — instead they're released gradually according to a "vesting / unlock schedule." There are two common patterns. Linear vesting: starting from a given point in time, tokens are released at an even pace by day or by month until a cutoff date when the full amount has been unlocked, producing a relatively smooth, predictable increase in supply. Cliff unlock: no tokens are released at all during the lock-up period; then, once a specific date is reached, a large lump sum unlocks all at once, sometimes followed by linear vesting and sometimes released in full immediately. Cliffs are common for early-investor and team allocations, typically set at milestones like six months or one year after TGE (Token Generation Event). Understanding which release pattern a project uses is the basis for judging whether future supply will arrive smoothly or in concentrated bursts.
4.2 Why researchers watch the window around unlock dates
Whether it's linear vesting or a cliff unlock, the shared point of interest is this: once a large batch of previously restricted tokens becomes transferable in a short period, the token's supply structure changes — showing up as fluctuations in metrics like the amount of transferable tokens on-chain, holder-address distribution, and the transfer activity between relevant addresses and exchanges. It's worth being explicit here: there is no necessary, predictable causal relationship between a change in supply-side conditions and price movement. Whether holders choose to transfer tokens out, whether transferred tokens get traded, and how the market absorbs that supply all depend on the combined effect of holder structure, prevailing market conditions, macro liquidity, and many other factors. Any inference that simply equates an "unlock" with "sell pressure" or a "trading signal" lacks rigorous support. From a research-methodology standpoint, the value of an unlock date is that it's a time marker you can flag in advance and observe continuously — researchers typically record changes in on-chain transfers and exchange-address balances around these dates as a reference point for cross-verifying tokenomics disclosures, not as a direct trading signal. It bears repeating here: a change in supply structure is a neutral thing to observe, and it does not constitute any kind of action prompt.
4.3 How to look up a vesting schedule
Common ways to look up a project's vesting schedule include: the unlock timetable in the project's official whitepaper or tokenomics documentation; supplementary announcements on the project's website or governance forum, since some projects post separate notices after adjusting their allocation plans; and third-party unlock-calendar tools, which typically aggregate unlock data across multiple projects and present it as a timeline for easy side-by-side comparison. Keep in mind that third-party tools vary in data source and update timeliness — for any consequential decision point, it's still best to defer to the project's latest official disclosure and cross-check against on-chain contract data wherever possible. It's also worth restating that the time windows discussed in this section are meant purely for research records and observation; they are not investment advice, and readers should not treat an unlock date itself as a basis for trading decisions.
5. Token utility and value-capture logic
5.1 Several common value-capture models
Another core question in tokenomics research is "what is this token designed to do" — commonly referred to as its value-capture mechanism. Different models simply represent different design paths, each suited to particular use cases and user groups; there's no general rule that one type of model is inherently superior to another, and actual effectiveness ultimately has to be tested against how the protocol actually performs. Common models include: Governance rights: holders can vote on protocol parameters, treasury usage, and other proposals; whether governance rights translate into economic value depends on whether governance decisions genuinely affect protocol revenue distribution and whether participation is actually active. Fee sharing or buyback-and-burn: the protocol uses part of its actual revenue to buy back and burn tokens, or distributes it directly to token holders — this creates a designed link between token value and the protocol's business revenue, but the strength of that link still depends on whether the protocol's revenue is itself stable and sustainable; it isn't inherently better than other models. Staking rewards: here we need to distinguish two mechanisms of a different nature. One is network consensus staking — in Proof-of-Stake (PoS) networks, for example, validators stake to help secure the network, and their rewards come mainly from new token issuance (inflation) plus transaction priority fees and MEV; this is fundamentally the network's incentive for participating in consensus, not a profit share from any specific business. The other is protocol governance-token staking, where some application-layer protocols let users stake governance tokens to share in fee revenue and other business income — this kind of return is more directly tied to the protocol's actual business performance. Conflating these two types of staking makes it easy to misjudge what's really behind a given "staking yield" figure — researchers should first determine whether a given staking yield comes from new issuance or from actual protocol revenue, since that's the key premise for judging whether the yield is sustainable. In-ecosystem settlement medium: the token is designed as a medium for payment, settlement, or collateral within the ecosystem, with demand tied to actual ecosystem usage.
5.2 "Having a use case" is not the same as "having demand"
Another trap researchers can fall into is equating "the token has a designed use case" directly with "the token has real demand." A token can be assigned multiple roles in its documentation — governance, staking, settlement — but if the protocol's actual usage is low, governance-proposal participation has been persistently weak, and staking yield comes mainly from new token issuance rather than protocol business revenue, then these "use cases" remain largely on paper and haven't yet translated into sustained real demand. Judging how a value-capture mechanism actually performs generally requires going back to the protocol's real revenue and active-usage data — one more reason tokenomics research can't be separated from fundamentals analysis. It's worth restating that the discussion here is only about methodological differences between mechanism types; the mechanism type itself is not a judgment on the merits of any particular project or token design. The same mechanism can perform very differently across different protocols in practice, so any specific judgment needs to be grounded in case-by-case data rather than applying a fixed framework that labels one mechanism as "better" or "worse" — and none of this should be used as a basis for buy or sell decisions.
6. Using on-chain data to cross-check whitepaper tokenomics disclosures
This section builds on the approach to reading on-chain data covered in the second article, applying it specifically to verifying tokenomics.
- Check concentration using holder-address distribution: use a block explorer to view the top-holder ranking for a token contract, and look at what share of circulating supply the top ten or top fifty addresses hold. If concentration is significantly higher than the impression of "non-team holdings" given by the allocation documentation, that suggests actual holdings may be more concentrated than the pie chart implies, warranting a further check on whether those addresses belong to exchanges, cross-chain bridge contracts, or team-linked multisigs.
- Verify lock-ups against documentation using contract and multisig addresses: most legitimate projects hold team and foundation allocations in publicly addressable lock-up contracts or multisig wallets. Researchers can compare the lock-up ratios and unlock timetable disclosed in the whitepaper against the actual amounts locked and historical transfer-out records in the contract, item by item, to judge whether actual execution matches the documented description.
- Observe on-chain activity around unlock dates using exchange address inflows/outflows: combining this with the exchange-address labeling approach from the second article, researchers can check, around a known unlock date, whether transfers from relevant addresses to exchange addresses noticeably increase. This can serve as one reference signal for tracking where unlocked tokens go, but as discussed in Section 4, this kind of observation only reflects on-chain activity itself and cannot, on its own, serve as a basis for predicting price movement.
- Cross-check multiple data sources: block explorers, professional on-chain analytics platforms, and a project's own transparency page sometimes disclose different circulating-supply and lock-up figures. When discrepancies show up, give priority to data that can be traced directly back to an on-chain contract address, rather than relying solely on a single platform's secondary compilation.
The core logic of this cross-verification process is: the whitepaper tells you "what the design is supposed to look like," and on-chain data tells you "what actually got recorded on-chain." A discrepancy between the two is itself a research finding worth recording and continuing to watch — it doesn't necessarily mean the project has a problem, and it shouldn't be read directly as any kind of trading signal. One reminder: all of the methods above are for research records and documentation verification; none of this constitutes investment advice, and readers bear full responsibility for any decisions made based on it.
7. Observation points worth recording during research
Building on the discussion above, here are a few observation points commonly mentioned in tokenomics research that are worth recording and tracking over time, offered as a reference for researchers' own work — again, purely at the level of methodology, without targeting any specific project. One important caveat: the items listed below are just leads worth noting during research, not evaluation criteria, and they do not constitute a value judgment on any project that does or doesn't exhibit these features. The presence of any one feature neither means a project necessarily has a problem nor that it is necessarily "safe" — whether it warrants further attention depends on the full picture of the specific project and each researcher's own judgment; again, this discussion does not target any specific project.
- Team and investors together hold a large share with a short lock-up period: if the combined share held by the team and early investors is notably high, and the unlock period is set short, early participants can obtain a large amount of unlocked tokens in a short time. This kind of structure is worth recording and continuing to watch alongside on-chain transfer activity — it does not automatically amount to a negative conclusion.
- Circulating supply is a small share of max supply, with a wide gap between FDV and circulating market cap: when current circulating supply is small but the FDV figure is large, it indicates a substantial amount of tokens still to be released. In this situation, relying only on circulating market cap may understate the potential future supply, so it's worth recording FDV alongside the vesting schedule together — this is simply a feature of the supply structure, not a judgment on the token's value.
- Vesting disclosures are vague or change frequently: a whitepaper that describes the unlock timetable ambiguously, or a project that repeatedly adjusts its unlock arrangements without a clear governance process explanation, both make it harder for researchers to verify information, and are worth tracking as an ongoing record.
- A governance token with no clear description of its value-capture mechanism: a token that carries only voting rights, with no documentation explaining any link between protocol revenue and token holders — this is simply one of many possible value-capture designs, and researchers can treat it as a lead for looking further into the protocol's other revenue-distribution arrangements.
- A "community share" that looks dispersed but turns out concentrated once verified on-chain: allocation documentation shows the community/ecosystem category as widely spread, but on-chain holder-address verification reveals it's actually concentrated in a small number of addresses. This gap between documentation and on-chain evidence is itself worth recording, with the underlying reason requiring further context about the specific project.
- Insufficient transparency around key addresses: team or foundation holdings with no corresponding publicly identifiable address, or a multisig wallet whose signers' identities are unclear, making on-chain verification difficult for researchers — this is a limitation on research feasibility, and worth noting for the record.
Once more: the above is a checklist of methodological leads for research records, not an operating manual to be applied directly. Any specific judgment needs to be drawn independently, based on the full picture of a project and cross-verification across multiple sources. This article does not offer a conclusive assessment of any token or project, and is not investment advice.
8. Summary
This article takes the "tokenomics" section that the first article compressed into a few lines and expands it into a full piece of its own. The core idea is actually simple: tokenomics starts out as a document that needs careful reading — covering supply structure, allocation ratios, vesting schedules, and value-capture logic. But the document alone can't prove itself true or false; solid research needs to go back to the chain and use holder-address distribution, lock-up contract records, and exchange inflow/outflow data to check, item by item, whether what's disclosed matches what's actually been executed.
As a closing scenario that runs through the whole article: when you pick up a new project's tokenomics documentation, you can work through a few questions in order — what are max supply and circulating supply, and which basis is FDV using; is the team's and investors' lock-up and unlock schedule clearly written; does the on-chain top-holder ranking roughly match the impression given by the allocation pie chart; and is the value-capture mechanism described concretely enough to map onto the protocol's real revenue or usage data. Working through these questions amounts to one full pass combining documentation review with on-chain verification.
Finally, to restate once more: everything in this article is a discussion at the level of learning and research methodology. It does not pass judgment on the value of any specific token or project and is not investment advice of any kind. Crypto asset prices are highly volatile and carry substantial risk; readers should exercise independent judgment and take responsibility for their own decisions.