
Verification Checklist
- ✓Check whether an "ecosystem thriving" claim is based on protocol count, TVL scale, or fee revenue — the three carry very different meanings of activity
- ✓Query fee revenue for all protocols in that sector from a public data platform, compute the top protocols' share, and compare it against TVL concentration
- ✓Understand that fee revenue is much harder to artificially manipulate than TVL, making it a more reliable indicator of genuine protocol usage
- ✓Check the real revenue scale of long-tail protocols (the large majority ranked lower) to judge whether a "hundreds of protocols" claim carries practical meaning
1. Neither Protocol Count Nor TVL Is Reliable Evidence of "Ecosystem Thriving"
A statement like "this sector has hundreds of protocols" carries almost no information by itself, because the barrier to deploying a DEX smart contract is low — any team can fork an off-the-shelf AMM code template and launch a new protocol, so protocol count growth can happen entirely independently of genuine user demand. TVL is similarly prone to being misread as a prosperity signal — TVL can balloon quickly because a protocol launches heavy token incentives to attract liquidity providers to deposit assets, and those assets may generate almost no real trading at all, simply "parked" in the protocol to farm token rewards; once the incentives end, that TVL can exit just as quickly. Fee revenue, by contrast, is fundamentally different: every fee corresponds to an actual trade that was executed, and a user must genuinely want to complete a swap to pay it — this metric cannot be conjured out of token subsidies or marketing narrative.
Precisely because fee revenue is much harder to artificially manipulate, it more genuinely reflects how concentrated capital and activity actually are around leading protocols. A verifier who concludes "this sector is fragmented, competition is robust" purely from protocol count or TVL scale may be overlooking a plainer fact: even with hundreds of protocols coexisting, only a tiny handful might actually be used consistently by a large number of users to complete trades.
- Protocol count growth can happen entirely independently of genuine user demand, since the deployment barrier is low and count alone is not evidence of activity.
- TVL can balloon from token incentives, with those assets generating little real trading, and can exit just as quickly once incentives end.
- Fee revenue corresponds to actual executed trades and cannot be conjured from token subsidies or narrative, making it a more reliable activity indicator.
2. Real Data: The Actual Fee Revenue Distribution Across the DEX Sector
Verified Data
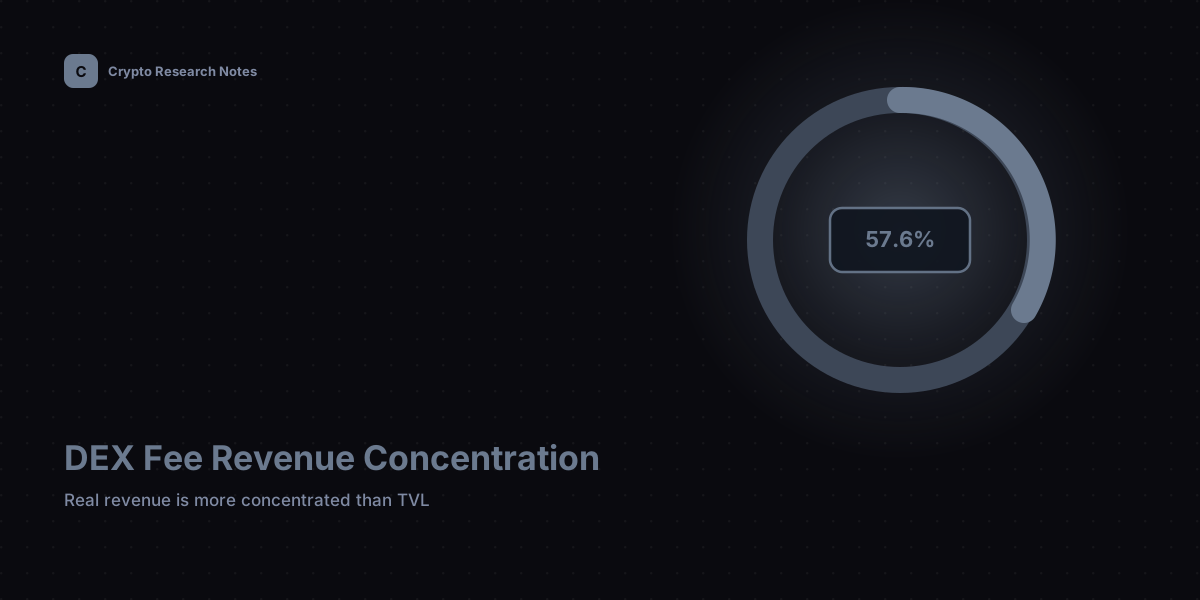
Real data pulled from DefiLlama's public API (/overview/fees, filtered to category=Dexs) at the time of verification in September 2026: on that day, 469 DEX protocols generated fee revenue, totaling approximately $18.4125 million in combined 24-hour fees. Of that, the top 3 protocols by revenue (Uniswap V4, PumpSwap, Uniswap V3) accounted for approximately 57.56% combined, and the top 10 protocols accounted for approximately 90.71% combined — meaning the remaining 459 protocols (nearly 98% of the total protocol count) collectively shared less than 10% of total fee revenue. These figures can be independently re-verified through DefiLlama's public API; the specific rankings and shares shift continuously with market activity.
The degree of concentration this data reveals is far more extreme than most people would imagine from a statement like "there are numerous protocols." Among 469 protocols, the top 3 alone captured over half of the revenue — a concentration level even higher than the TVL concentration many verifiers are already familiar with, because TVL can be spread out and inflated by incentive-driven deposits across a long tail of protocols, whereas fee revenue is almost entirely driven by genuine user trading demand, which naturally tends to concentrate around the protocols with the deepest liquidity, lowest slippage, and strongest brand recognition. If a verifier sees a claim like "the DEX sector has 469 protocols," they should recognize that among those 469, likely only a single-digit number are actually generating meaningful, sustained trading volume and revenue — the vast majority may sit in a state of near-zero real usage for extended periods.
- Real September 2026 data: among 469 DEX protocols, the top 3 accounted for about 57.56% of 24-hour fee revenue, and the top 10 accounted for about 90.71%.
- The remaining approximately 459 protocols (nearly 98% of the total count) collectively shared less than 10% of fee revenue, indicating extremely low real activity among long-tail protocols.
- Fee revenue concentration is often more extreme than TVL concentration, since TVL can be spread out by incentive-driven deposits while fees directly reflect genuine trading demand.
3. Verification Method One: Distinguish Whether "Thriving" Refers to Count, TVL, or Revenue
The first step in verifying a report claiming "ecosystem thriving" or "hundreds blooming" is to check whether the specific evidence cited is protocol count, aggregate TVL, or fee/revenue data. If a report only cites protocol count or total TVL, verifiers should proactively ask: how many of these protocols are actually generating meaningful fee revenue? Verifiers can query protocol count, TVL rankings, and fee rankings for the same sector simultaneously through platforms like DefiLlama, comparing the concentration each reveals to judge whether the report's chosen metric is representative.
Verifiers should be especially wary of reports that only emphasize "protocol count hitting a new high" while entirely omitting revenue data — this kind of selective citation is itself a signal worth noting. If revenue data also supported a "thriving" conclusion, a report would typically cite it proactively; conversely, avoiding revenue data while only discussing count often suggests the real revenue distribution may not actually support a "blooming" narrative.
- Check whether a report's cited evidence is specifically protocol count, TVL, or fee/revenue data — the three carry different meanings of activity.
- Query all three data sets for the same sector through platforms like DefiLlama, comparing concentration to judge whether the report's basis is representative.
- A report that only emphasizes protocol count while avoiding revenue data often suggests the real revenue distribution may not support a "blooming" narrative.
4. Verification Method Two: Use a Simplified Top-Share Metric for Quantitative Comparison
Verifiers can borrow a simplified approach from economic market-concentration measures — without computing a full Herfindahl index, simply calculating the top-3 and top-10 protocols' share of total revenue provides a quick, comparable quantitative benchmark. If a sector's top-3 revenue share exceeds 50%, that typically indicates a highly concentrated, winner-take-most market, and a "hundreds of protocols" claim in that context is more a nominal accumulation of numbers than substantive, broad-based competition. Verifiers should compare this top-share figure against the same sector's historical data from prior months, observing whether concentration is expanding or shrinking — this reveals the trajectory of the competitive landscape far better than a single static snapshot.
Verifiers should also watch for turnover among the specific protocols occupying the top 3 — if the exact names change frequently over short periods, that suggests internal competition within the sector remains intense and leading positions are not yet entrenched; if the top names stay stable over long periods, that suggests the sector has already formed a fairly entrenched moat advantage, making it difficult for new entrants to disrupt the existing order.
- Calculating the top-3 and top-10 protocols' revenue share provides a quick quantitative benchmark for sector concentration without needing a complex index.
- A top-3 share exceeding 50% typically indicates a highly concentrated, winner-take-most market, where a "hundreds of protocols" claim is more nominal accumulation than substantive competition.
- Observe the historical trend of the top share and turnover among specific protocol rankings to judge whether the competitive landscape is entrenching or still intensely contested.
5. Verification Method Three: Check Whether Long-Tail Protocols' Real Revenue Scale Is Meaningful
After confirming top-level concentration, verifiers should further examine the specific revenue figures for long-tail protocols (the large majority ranked lower), rather than stopping at a vague statement like "the remaining protocols collectively account for less than 10%." Dividing that remaining share by the number of long-tail protocols yields an average revenue level per long-tail protocol — a figure often low enough to directly demonstrate these protocols have essentially no substantive user trading. For example, if the top 10 among 469 protocols account for 90.71%, the remaining 459 protocols collectively share only about 9.29% of revenue (roughly $1.71 million), averaging under $4,000 in 24-hour fee revenue per protocol — a figure that typically can't even cover a protocol's basic operating costs, let alone support a claim of an "active ecosystem."
Verifiers should treat this kind of long-tail protocol real revenue scale as key corroborating evidence when judging the practical meaning of a claim like "this sector has numerous protocols" — protocol count is only an upper bound; what truly determines a sector's health is how many protocols actually clear an economically meaningful revenue threshold, not the nominal total number of protocols indexed by a platform like DefiLlama.
- Calculate the average revenue level of long-tail protocols rather than stopping at a vague "remaining protocols account for under 10%" statement.
- In this article's real data, long-tail protocols average about $4,000 in 24-hour fee revenue, typically insufficient to cover basic operating costs.
- Protocol count is only a nominal upper bound — what truly determines sector health is how many protocols clear an economically meaningful revenue threshold.
6. Verification Checklist and Conclusion
Consolidating the preceding sections into a reusable checklist: First, is a report's "ecosystem thriving" claim specifically based on protocol count, TVL scale, or fee revenue, and are these being conflated to support the same conclusion? Second, has the top-3 and top-10 protocols' revenue share for that sector been queried and compared against TVL concentration? Third, has the historical trend of the top share and turnover among specific protocol rankings been observed to judge the trajectory of the competitive landscape? Fourth, has the average revenue level of long-tail protocols been calculated to judge whether a "hundreds of protocols" claim carries practical economic meaning? Only after working through these four questions can a report claiming "ecosystem thriving, hundreds blooming" be accurately assessed, rather than taken at face value from a nominal protocol-count ceiling. This article discusses verification methodology only and does not offer any conclusive judgment about the current competitive state of any specific protocol or sector; for research and educational purposes only, not investment advice.
- Four-question checklist: is the evidence basis clear, is the top share quantified, is the concentration trend observed, is long-tail revenue verified.
- Real September 2026 data shows that among 469 DEX protocols, the top 3 accounted for about 57.56% of 24-hour fee revenue, and the top 10 about 90.71%.
- This article discusses verification methodology only and offers no conclusive judgment about the current competitive state of any specific protocol or sector; not investment advice.