
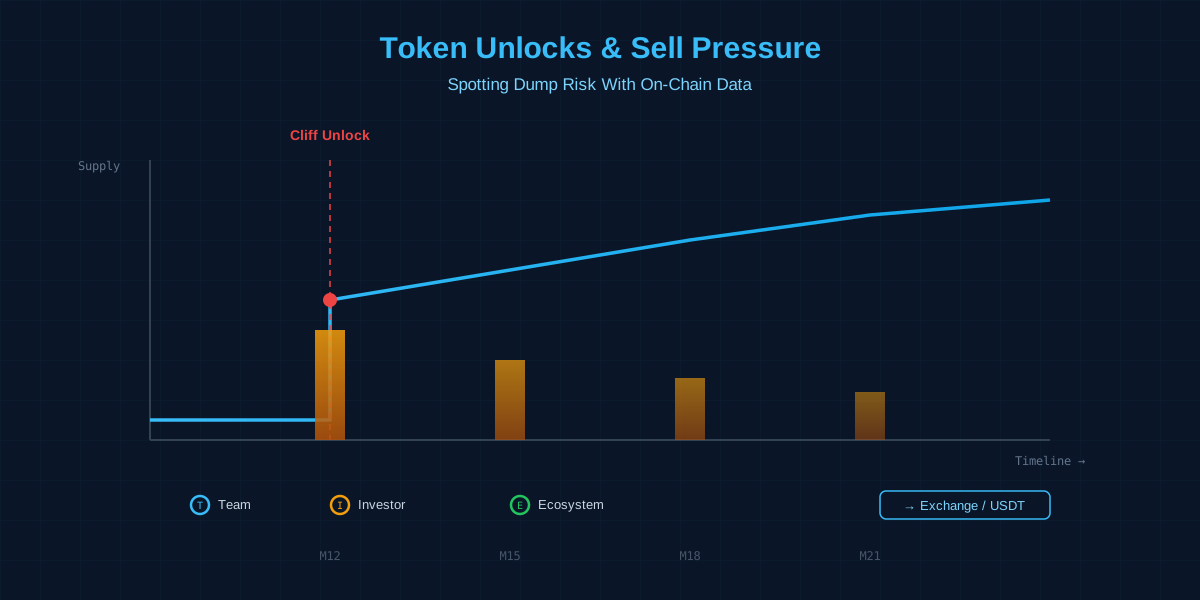
1. Why unlocks are always the turning point for price
Start with something many people overlook: when a crypto project raises early money and issues its token, the coins that go to the team, investment funds, and advisors are almost never sellable right away. They are locked into a vesting schedule and released slowly, month by month or quarter by quarter. The design is meant to align long-term incentives, but it also plants a certain, deterministic event — every time a batch unlocks, the circulating supply jumps. More supply against flat demand means price pressure. The only variable is whether holders choose to sell, and how fast.
The reason unlocks reliably become turning points is the cost gap. Early investors may have entered at a fraction of the secondary-market price, so even after the token has halved, selling is still a multiple — sometimes dozens of times — on their basis. For that supply, unlock day carries almost no psychological reluctance to sell. Retail, meanwhile, bought high in the open market, at a high cost and in scattered lots, and can rarely hedge effectively before the unlock. That is why unlock action so often looks like "grind down early, dump on the day, stay depressed after" — smart money using its information and cost advantages to harvest liquidity.
And this is exactly where the research value hides: unlock timing and amounts are publicly written into the tokenomics, on-chain transfers are public, and exchange addresses are labeled. In other words, sell pressure is not a total black box — it is something you can estimate ahead of time with on-chain data. What this article does is break "estimating sell pressure" into executable steps: reading the vesting curve, classifying wallets, then using exchange deposits and USDT on/off-ramp flows to back out the real selling. This is a branch of on-chain security research: you are not predicting price, you are assessing structural risk.
- Unlocks are deterministic events written into tokenomics that suddenly raise circulating supply and pressure price structurally.
- Early supply has a very low cost basis, so unlock-day selling faces little resistance — hence the "grind down + day-of dump" pattern.
- Unlock timing, amounts, on-chain transfers, and exchange addresses are all public, so sell pressure can be estimated in advance with on-chain data.
2. Reading the vesting curve: cliffs, linear release, and cadence
To estimate sell pressure, step one is understanding the project's vesting curve. A vesting curve usually has two parts: the cliff and the linear vesting period. The cliff is a stretch after issuance during which nothing unlocks at all — a "12-month cliff" means none of that supply can move for the first year. When the cliff ends, a chunk typically unlocks all at once (the "cliff release," the most dangerous moment), and the rest vests linearly over the following months.
Why is the cliff release the most dangerous? Because it is a one-shot, large supply shock. If a project is designed as "12-month cliff, then 20% released at once, remaining 80% vesting linearly over 24 months," then on that day in month 12 the circulating supply can jump sharply — and the market usually anticipates the date well, positioning short or trimming in advance. Linear release, by contrast, adds a small increment each day that the market absorbs more smoothly. But if several investor tranches vest linearly within the same time window, the cumulative effect is nothing to dismiss either.
In practice, what you need to do is translate the vesting terms from the whitepaper or tokenomics doc into a table of "monthly unlock amounts over the next 12 months": how many new tokens each month, what percentage of current circulating supply that is, and which holder class it belongs to. Many third-party platforms (unlock-calendar tools) already organize the schedules for major projects, but I strongly recommend cross-checking the original source at least once — projects sometimes adjust vesting terms, or release early/late via off-chain commitments, none of which automatically shows up on a third-party dashboard. Computing the "percent of circulating supply" matters most: a release that is only 1% of float barely registers; one that is 20% or more is a supply shock worth watching closely.
- The vesting curve usually has a cliff (nothing unlocks) and a linear period; the one-shot release when the cliff ends is the most dangerous supply shock.
- Translating vesting terms into "monthly unlock amount + percent of float" is the foundational work for estimating sell pressure.
- Cross-check third-party calendars against the project's original docs, and watch for off-chain adjustments that skew the schedule.
3. Classifying wallets: team, investor, and ecosystem supply
Even for the same unlock, different holder types differ wildly in willingness to sell — so step two is classifying the unlocking addresses. The three most common buckets in on-chain research are: team/foundation, private investors, and ecosystem/incentives.
3.1 Team and foundation
Team wallets are usually the largest unlock and the most closely watched. Teams selling gets read as "insiders turning bearish," so reputable projects manage this supply through timelock contracts and public multisig addresses, and often disclose sell plans proactively. On-chain, your job is to find the officially disclosed team address and watch where the tokens go after they unlock — do they stay in the wallet, or move to an exchange deposit address? Staying put suggests no near-term intent to sell; moving to an exchange is a clear potential sell-pressure signal.
3.2 Private investors
Investor supply is defined by a very low cost basis, scattered tranches, and freedom from the "bearish signal" reputational constraint — a fund's job is to realize gains at the right time. These addresses tend to act most decisively after unlocks. Ways to identify investor addresses include: tracing the early distribution transactions (at TGE, which contract sent tokens to which addresses) and combining public fundraising info (which funds participated, how much) to back out holding sizes. When you see several low-cost addresses transfer in sync to exchanges or OTC addresses after an unlock, that is a strong signal that sell pressure is about to materialize.
3.3 Ecosystem and incentives
Ecosystem funds, liquidity incentives, and airdrops are more scattered, and their selling is harder to predict — a user who receives incentives might dump immediately or hold long term. This supply shows up more as "continuous small sells" than a concentrated dump. In research, watch the release rate of the incentive contract and whether recipients show a "claim then send to exchange" pattern. If you want to track fund flows between these addresses more systematically, address-labeling and fund-tracing tools can reconstruct scattered transfers into a single flow map. Pairing this with a reliable on-chain swap and exchange entry point for live observation makes the whole tracing workflow much smoother.
- Team/foundation supply is the most watched; focus on whether it moves to exchange deposit addresses after unlocking.
- Investor supply is low-cost and decisive; multiple addresses moving to exchanges in sync is a strong sell-pressure signal.
- Ecosystem/incentive supply is scattered and shows up as continuous small sells; watch for consistent "claim then send to exchange" behavior.
4. Exchange deposits and USDT flows: the direct signal
With the vesting curve and wallet classification done, you now hold a map of "who can sell how much, and when." But "can sell" is not "is selling." Step three is finding the direct evidence that turns intent into action — tokens flowing into exchange deposit addresses, and the USDT on/off-ramp moves that follow.
4.1 Why exchange deposits are the hardest signal
If a holder merely shuffles tokens between their own wallets, price is barely affected; only when tokens move into an exchange deposit address do they enter a state where they can be sold at any moment. So the transfer path "unlock address → exchange deposit address" is the key hop where sell pressure goes from potential to real. Major exchanges' hot wallets and deposit addresses are mostly labeled by on-chain data platforms, so you can filter directly: in the 24 to 72 hours after an unlock lands, how much of the unlocked supply flowed to labeled exchange addresses. That number is closer to real sell pressure than the "theoretical unlock amount," because it strips out the portion that chose to keep holding.
4.2 Using USDT flows to back out the selling cadence
After tokens are sold, where does the money go? In the vast majority of cases it is first converted to a stablecoin like USDT, then either kept on the exchange, sent out to an on-chain wallet, or moved through the on/off-ramp to exit. So USDT flows help you back out the size and pace of the selling: if you see an account linked to an unlock address make large USDT withdrawals or frequent stablecoin transfers after the unlock, that usually corresponds to a completed round of realized selling. Understanding how USDT's on/off-ramp and reserve mechanics work lets you see the full chain of "token sold → converted to stablecoin → funds exit," rather than staring only at the token side.
4.3 The hidden paths: cross-exchange and OTC
Note that not all selling goes through the public spot book. To avoid slippage from directly dumping, large holders often transfer via OTC deals or split supply across multiple exchanges to sell in batches. On-chain, these paths look like "transfer into an OTC market-maker address" or "small simultaneous deposits to several exchanges" — harder to spot than a single large deposit, and more worth caution, precisely because they suggest the holder is deliberately hiding their intent to sell. For researchers who settle cross-border frequently or subscribe to on-chain services, a compliant, stable US virtual credit card removes a lot of payment friction; virtual card issuers like RDVCC are also commonly used to subscribe to on-chain data tools.
- "Unlock address → exchange deposit address" is the key signal that turns sell pressure from potential into real, and can be filtered directly via labeled addresses.
- Large USDT withdrawals and transfers back out the size and cadence of selling, completing the fund-exit chain.
- OTC and multi-exchange batch selling are hidden sell-pressure paths, harder to spot than a single large deposit and more worth caution.
5. On-chain blind spots: early transfers, proxies, and wash trading
By now the standard sell-pressure estimate is complete. But the highest-value part of on-chain research is often the moves that "don't follow the rules" — the ones hiding in the blind spots of the data, where you need to keep an extra eye out.
5.1 Early transfers and lock evasion
Some projects enforce locks with off-chain commitments rather than smart contracts, which leaves room for "early transfers" — the nominal lock period has not ended, yet the supply is already quietly moving through related addresses. To spot this, you compare the "officially claimed lock address" against the "related addresses that actually have transfer activity." If a team address that claims a two-year lock is frequently swapping with an active trading account on-chain, that is a risk point to flag. Projects that truly enforce locks via contract let you read the timelock's unlock time directly on-chain, with no early access possible.
5.2 Proxy holding and address obfuscation
To make on-chain holdings look more dispersed and more "decentralized," some holders split large supply across dozens of seemingly unrelated proxy addresses. On the surface, no single address holds an outsized amount — but after an unlock these addresses show highly synchronized behavior: depositing to the same exchange at the same time, converting to stablecoins at the same time. Only by reconstructing the fund-flow relationships among these addresses can you see the real concentration. This is exactly why surface metrics like "number of holder addresses" are easy to be misled by.
5.3 Market-maker wash trading and fake liquidity
Around unlocks, price and volume sometimes turn abnormally active, which can be market makers wash trading — using multiple accounts they control to trade against each other, manufacturing fake volume and price support so there is enough "buy-side liquidity" to cover their exit when the unlock sell pressure arrives. Clues for spotting wash trading include: volume swelling while price barely moves, highly symmetric buy/sell flow, and a small set of trading addresses that recur repeatedly. This edges into the gray zone of market manipulation and, from an on-chain security and compliance research angle, deserves separate attention. When doing this kind of cross-platform fund and address tracing, a handy going-global navigation directory helps you quickly find entry points to various on-chain analytics and data platforms.
- Early transfers: compare the officially claimed lock address against related addresses that actually show transfer activity.
- Proxy holding and obfuscation: reconstruct the fund flows among scattered addresses to see true concentration.
- Market-maker wash trading: volume swells while price barely moves and buy/sell is highly symmetric — beware fake liquidity covering an exit.
6. A pre-unlock checklist you can run without code
Condensing the above: even if you cannot write scripts or read Solidity, you can run a full pre-unlock due diligence pass using public tools. Here is a checklist you can follow directly.
First, check the unlock schedule. Use an unlock-calendar tool to confirm unlock events over the next 3 to 6 months, flagging dates where a single release is over 10% of float — those are the high-risk moments. Second, verify the source. Compare the third-party dashboard against the whitepaper and official announcements once, to confirm there are no off-chain adjustments. Third, classify the large addresses. Identify team, investor, and ecosystem addresses, and see clearly which batch is approaching its unlock. Fourth, watch exchange flows. Around unlock day, observe whether these addresses start transferring to labeled exchange deposit addresses — the most direct action signal.
Fifth, watch stablecoin moves. Note large USDT withdrawals or frequent transfers from linked accounts to back out whether selling is already being realized. Sixth, check for anomalies. Compare lock commitments against actual transfers, and watch for abnormally active price/volume. Seventh, judge alongside fundamentals. The same unlock amount lands very differently on a project with real revenue and steady growth versus one propped up purely by narrative — an unlock is only a stress test; whether it holds depends on the project itself. Run these seven steps and your risk picture for an unlock is basically clear. One caveat: this checklist assesses "structural sell-pressure risk," not price prediction — on-chain data tells you how big the pressure is, but where the market ultimately goes is shaped by macro sentiment, whale games, and far too many other factors.
- Check the schedule and flag dates over 10% of float as high-risk; verify the original source to avoid drift.
- Classify large addresses and watch transfers to exchange deposit addresses and USDT withdrawals around unlock day.
- Compare lock commitments against actual transfers to check anomalies, then judge market absorption alongside fundamentals.
7. Wrap-up and disclaimer
Token unlocks are one of the rare "certain events" in crypto — the timing and amounts are public, and the only information gap is whether you are willing to do the work and measure the sell pressure with on-chain data ahead of time. This article broke that into a few steps: read the vesting curve to find high-risk moments, classify wallets into team, investor, and ecosystem supply, use exchange deposits and USDT flows to find the direct evidence of sell pressure being realized, and watch for early transfers, proxy holding, and market-maker wash trading hiding in on-chain blind spots. The value of this method is not "predicting tomorrow's candle" but giving you a verifiable, reproducible read on a project's structural risk before you participate.
To reiterate, this article is a methodology discussion only. It draws no conclusions about any specific project, token, or team, and is not investment advice of any kind. On-chain data reveals objective facts about fund flows, but interpreting those facts and choosing how to weigh the risk is ultimately your own decision. Crypto assets are highly volatile and extremely risky — please judge independently and only do what you can afford. The tools, data platforms, and methods mentioned here may change over time and with the market; always refer to the latest information from official sources.