
1. Why Auto-Deleveraging Exists: The Last Line of Defense in the Liquidation Waterfall
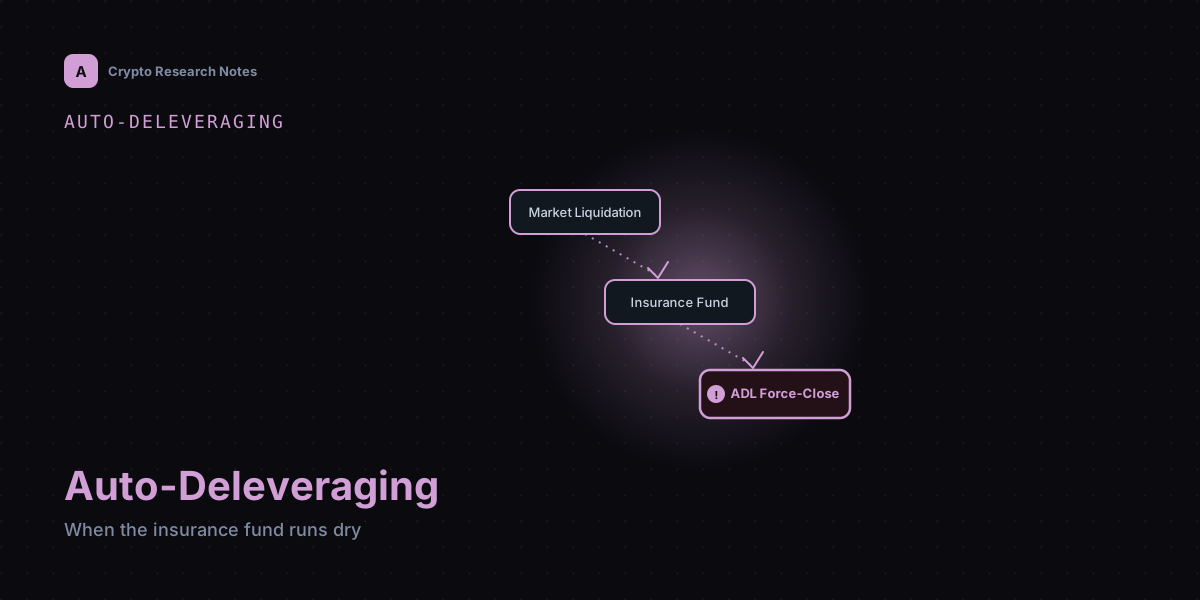
A perpetual futures exchange handles a liquidated position through a sequence of escalating fallbacks, and understanding that sequence as a waterfall — rather than as a single event — is the starting point for reasoning about auto-deleveraging at all. The first tier is ordinary liquidation: once a position's margin falls below the maintenance threshold, the exchange closes it in the open market, ideally at or near its bankruptcy price, the price at which the position's remaining margin is exactly exhausted. Under normal depth conditions this tier absorbs the vast majority of liquidations without any further consequence.
The second tier activates when the market cannot absorb the closure at a reasonable price — thin order-book depth, a fast-moving symbol, or a liquidation large relative to available liquidity means the position gets closed worse than its bankruptcy price, leaving a shortfall. This is precisely what an insurance fund is engineered for: a pooled reserve, typically seeded from liquidation surplus on the opposite, well-behaved cases, that absorbs exactly this kind of gap so the loss does not have to be passed anywhere else.
The third tier is the one this article is about. If the shortfall exceeds what the insurance fund can cover — a large enough move, a thin enough fund, or both — the exchange has no further capital of its own to draw on. It is not a bank; it does not warehouse the loss on a balance sheet. Instead it claws the loss back from the other side of the same contract: the winning counterparties. Auto-deleveraging is that clawback mechanism, and its existence as a last resort, invoked only after two prior layers have already failed, is precisely why it should be read as a structural circuit breaker rather than a routine cost of doing business.
- Tier one: ordinary liquidation closes the position in the market, ideally at its bankruptcy price.
- Tier two: the insurance fund absorbs any shortfall when the market cannot close the position cleanly.
- Tier three: when the fund itself is insufficient, ADL claws the unpaid loss back from profitable counterparties.
2. How ADL Selects Counterparties: Why Profitable Positions, Not Random Ones
When ADL activates, the exchange does not select which opposing positions to force-close arbitrarily, nor does it spread the closure proportionally across every open position on that side of the market. Most venues instead maintain a continuously updated ranking of counterparties, computed from a combination of unrealized profit percentage and leverage used. Positions scoring highest on both dimensions sit at the top of the queue and are the first candidates to be force-closed, partially or in full, to absorb the shortfall left behind by the liquidated trader.
The reasoning behind that ranking is worth making explicit rather than treating as a black box. Profit percentage and leverage together function as a proxy for surplus capacity: a position that is both highly profitable and highly leveraged has, relative to its margin footprint, the largest cushion of unrealized gain available to absorb an involuntary closure without itself being pushed into a loss it cannot bear. A marginally profitable or low-leverage position has far less room to give.
This is also why the mechanism deliberately targets profitable positions rather than distributing the loss randomly or pro-rata across the whole open-interest base. A random or proportional approach risks touching positions that are near their own liquidation threshold, which could convert a single shortfall into a second wave of forced closures — precisely the cascading dynamic a researcher should already be alert to. Ranking by profit and leverage concentrates the clawback on accounts best equipped to absorb it, and the closure itself executes at the liquidated trader's bankruptcy price, not the prevailing market price, which is why an ADL-closed position is a materially worse outcome than an ordinary market exit.
- Counterparties are ranked by a combined profit-percentage and leverage score, not chosen randomly.
- High rank signals surplus capacity: room to absorb a forced closure without cascading into further liquidation.
- Forced closures execute at the liquidated trader's bankruptcy price, not the market price at the time.
3. Verifying Insurance Fund Size: Is the Claimed Number Actually Checkable
A displayed insurance fund balance carries the same epistemic status as any other headline figure this series has repeatedly cautioned against accepting at face value: it is a claim made by an interface, not a fact a researcher has independently confirmed. The first question to ask is structural — is the fund held in an identifiable, publicly queryable on-chain address, or is it simply a number rendered on a dashboard with no address attached at all? The former is independently verifiable by any researcher with a block explorer; the latter is self-reported and rests entirely on the exchange's own accounting.
Where an address is published, verification does not stop at confirming the address exists. A researcher should check whether the balance can be queried in real time rather than only through a static, periodically refreshed snapshot, and whether the exchange (or a third party) publishes a historical balance chart rather than a single point-in-time figure. A time series matters because it reveals drawdown behavior — how much the fund actually depleted during past volatile episodes and how quickly it was replenished — which a single current balance cannot show at all.
A further wrinkle worth checking is custody structure: some funds span multiple chains or multiple wallets that need to be aggregated to reconstruct the true total, and an on-chain balance, even when verifiable, does not by itself prove the fund is segregated from the exchange's other operating capital. That last point echoes a lesson from proof-of-reserves research elsewhere in this series — verifying that a balance exists is not the same as verifying what it is legally or operationally reserved for.
- Check whether the fund sits at a public, queryable on-chain address or only appears as a dashboard number.
- Prefer real-time balance access and historical drawdown charts over a single point-in-time snapshot.
- An address-level balance is not proof of segregation from the exchange's other operating capital.
4. Historical ADL Trigger Frequency as a Risk Signal: The Absence of Disclosure Is Itself a Signal
Beyond the fund's size, a second and distinct research question is how often the fund has actually been exhausted in practice. Many exchanges surface an ADL indicator on individual positions — commonly a light or bar scale showing a trader's current rank in the clawback queue — and some go further, publishing a historical log of ADL events by contract, including which symbols triggered it and how often. Both are worth locating before treating any specific market as safe from this mechanism.
Where that history is available, frequency itself is informative. A symbol whose ADL log shows repeated triggers over a given period indicates that the insurance fund's coverage is thin relative to that specific market's volatility and open interest — the fund is being exhausted by liquidation flow that, on a deeper or better-capitalized market, would have been absorbed at tier two without ever reaching the clawback stage. This is a per-symbol signal, not necessarily an exchange-wide one, since fund allocation and market depth both vary by contract.
The more consequential finding, however, is often the absence of any disclosure mechanism at all. If an exchange provides no historical ADL log and no queryable trigger history for a contract, a researcher has no way to distinguish two very different underlying realities: a market where ADL genuinely never happens because the fund is deep relative to that symbol's risk, and a market where it happens routinely but simply is not surfaced. The absence of a verification channel does not prove frequent triggering, but it removes the researcher's ability to rule it out — which itself belongs in any risk assessment of that market.
- Locate any per-symbol ADL indicator and any published historical trigger log before assuming a market is unaffected.
- Repeated triggers on one symbol signal thin fund coverage relative to that market's volatility and open interest.
- No disclosure mechanism means "never triggered" and "not disclosed" are indistinguishable from the outside.
5. Stress-Testing a Single-Symbol Liquidation Cascade That Exhausts the Insurance Fund
An earlier article in this series modeled cascading liquidation risk in lending protocols as a feedback loop: a price decline triggers liquidations, those liquidations generate forced selling, the forced selling pushes price further, and the loop restarts. The same feedback structure applies to a single perpetual futures symbol, with one addition specific to this venue: each liquidation shortfall draws down the insurance fund, and once the fund is exhausted, the remaining liquidations in the cascade have nowhere left to go except ADL.
Consider a fully invented illustrative scenario, with every figure fabricated purely to demonstrate the mechanics. A fictional symbol carries $200 million of open interest concentrated in leveraged long positions, and the exchange's fund allocated to that symbol sits at a fictional $8 million. A sharp 12% adverse price move pushes a first tranche of the most thinly margined longs to liquidation; thin order-book depth means they close at an average of 1.5% worse than their bankruptcy price, generating a fictional $3 million shortfall absorbed by the fund, leaving $5 million. The price continues sliding as liquidation-driven selling adds its own pressure, triggering a second, larger tranche whose shortfall — now $6 million, because depth has thinned further exactly when it is needed most — exceeds what remains. The fund is exhausted mid-tranche, and the unpaid remainder of that shortfall is the trigger point for ADL against the highest-ranked profitable short positions.
The methodological takeaway is that a researcher can approximate this exposure without waiting for it to happen: mapping liquidation price clustering on a symbol (the same open-interest crowding signal covered elsewhere in this series), estimating shortfall per tranche under a plausible depth-erosion assumption, and comparing the running total against the fund balance verified per Section 3 gives an approximate sense of how much further stress that specific market could absorb before ADL becomes a realistic outcome rather than a theoretical one.
- Cascading risk on a perpetual symbol mirrors lending-protocol cascades, with insurance-fund drawdown as the added constraint.
- All figures above are invented solely to illustrate tranche-by-tranche fund depletion, not observed data from any exchange.
- Comparing estimated shortfall per liquidation tranche against a verified fund balance approximates a symbol's ADL exposure.
6. Common Misconceptions and Conclusion
Three misconceptions recur often enough to state directly. The first is assuming that the mere existence of an insurance fund means losses can never reach a profitable trader's position — the fund is a finite buffer sized for typical shortfalls, not an unlimited guarantee, and ADL exists specifically for the scenario where that buffer runs out, as laid out in Section 1. The second is treating a stated insurance fund figure as a verified fact rather than a claim requiring on-chain confirmation, conflating a dashboard number with independently checkable evidence, as addressed in Section 3. The third is assuming ADL is a rare, largely theoretical mechanism rather than checking the actual historical trigger data for the specific symbol being traded, which Section 4 argued is often unavailable in the first place — and that unavailability should itself lower confidence rather than be read as reassurance.
Taken together, the six sections trace a single continuous line of inquiry: why the mechanism exists as the final tier of a liquidation waterfall, how it selects which counterparties absorb the clawback and why that selection specifically targets profit and leverage, how to verify the capital that is supposed to prevent the mechanism from ever needing to activate, how to check whether it has activated historically on a given market, and how to build an independent, order-of-magnitude estimate of how close a specific symbol currently sits to that threshold. None of these steps produces a certainty; together they replace a dashboard's assurances with a researcher's own evidence trail.
This article discusses abstract mechanism categories common to perpetual futures exchange design in general. It does not name, evaluate, or draw conclusions about any real exchange or protocol, and every figure used in the illustrative example in Section 5 was invented solely to demonstrate a calculation method. Nothing here constitutes investment advice or a recommendation regarding any specific position, market, or venue.
- An insurance fund is a finite buffer, not a guarantee that losses can never reach profitable positions.
- A stated fund balance is a claim until confirmed against a queryable on-chain address and its history.
- Treat missing ADL trigger disclosure as a gap in evidence, not as proof the mechanism rarely activates.