
1. Funding Rate as an Anchor, Not a Fee Line Item
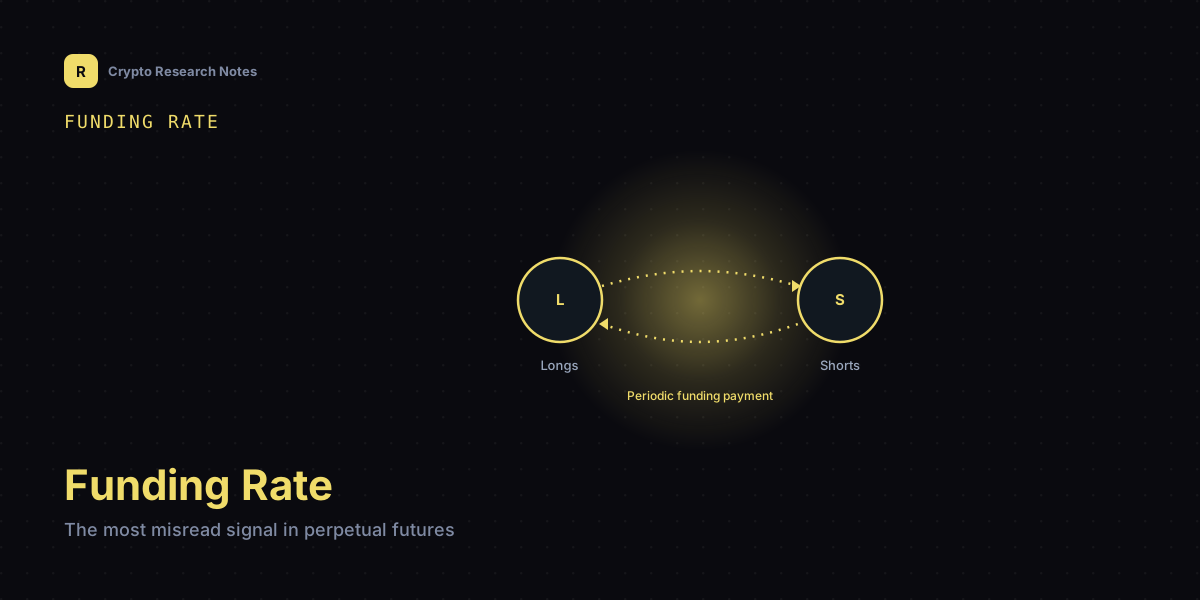
A perpetual futures contract has no expiry, which means it has no built-in mechanism forcing convergence to spot at some future settlement date. A traditional dated future converges to spot because it must — delivery or cash settlement enforces it. A perpetual has nothing analogous, so exchanges bolt on a funding mechanism: periodic payments exchanged directly between long and short position holders, sized to the divergence between the contract's price and an underlying index price. That payment flow is the entire anchoring mechanism. Without it, a perpetual contract could in principle drift indefinitely from spot, limited only by traders' willingness to arbitrage the gap manually.
Most researchers encounter funding rate as a line item — "I paid 0.01% today" — and stop there. That framing misses what the number actually encodes. Funding rate is a live readout of positioning imbalance: when far more capital wants to be long than short, longs must pay a premium to short holders as compensation for taking the other side, and that payment rate is set precisely so it becomes economically uncomfortable to keep piling into the crowded side. The more extreme the rate, the more one-sided the market's leveraged positioning has become — and one-sided leveraged positioning is exactly the precondition for a sharp reversal or a liquidation cascade, a theme this piece returns to in Section 5.
It is worth placing this mechanism relative to a related one already covered in this series. An earlier article examined AMM pricing and price impact — how a spot swap's execution price is determined by pool composition and trade size. Funding rate operates one layer up: it is not about how a spot price is formed, but about how a separate, expiry-less derivative price is pulled back toward whatever spot/index price already exists. The two mechanisms are adjacent, not identical, and conflating them causes researchers to misdiagnose which layer a given price anomaly actually originates in.
- Funding rate exists specifically because perpetuals lack a delivery date to force convergence.
- The payment flows directly between position holders, not to or from the exchange as a fee.
- Extreme funding readings are a crowding signal, not merely a cost or rebate figure.
2. Decomposing the Number: Interest Rate Versus Premium
The figure displayed as "funding rate" is almost never a single quantity — it is typically the sum of two structurally different components, and treating it as one number is the single most common source of misreading. The first component is an interest-rate term, reflecting the cost-of-carry differential between the two assets implicitly borrowed and lent in a perpetual position (for example, the base asset against a quote-currency stablecoin). This component tends to be small, changes slowly, and is often close to a fixed default absent unusual funding-market conditions elsewhere. The second component is a premium term, calculated from the actual observed gap between the contract's trading price and its index price over the funding interval. This is the volatile, fast-moving part, and it is the part that genuinely reflects positioning pressure.
Social commentary and headline coverage routinely collapse both into "funding spiked, therefore extremely bullish." That shortcut breaks down the moment the interest-rate component itself shifts — which can happen for reasons entirely unrelated to directional sentiment on the contract in question.
Consider a purely illustrative, invented example. Suppose a given perpetual product's displayed funding rate rises from 0.01% to 0.04% over a single interval. A researcher who decomposes the figure might find the interest-rate component held flat at roughly 0.01% throughout, while the premium component moved from effectively zero to roughly 0.03% — meaning the entire increase is attributable to a genuine widening of contract-versus-index premium, a real crowding signal. Alternatively, the same headline number could arise from the interest-rate component itself jumping to 0.035% with premium barely moving — a far less dramatic story about relative borrowing costs, not sentiment. These figures are invented purely to illustrate the decomposition, not observed values.
- Interest-rate component: small, slow-moving, tied to relative borrowing costs.
- Premium component: volatile, tied directly to contract-vs-index price divergence.
- Only the premium component reliably signals positioning sentiment.
3. Mark Price and Index Price: Who Is Actually Moving Whom
Liquidation triggers and unrealized PnL on most perpetual venues are calculated against a "mark price," deliberately distinct from the contract's raw last-traded price. The reason is defensive: if liquidations were triggered off the thin, easily-nudged order book of the derivatives contract itself, a relatively small amount of capital could push the last-traded price briefly, trip a wave of liquidations, and profit from the resulting cascade. Mark price is designed to blunt that attack by blending in external spot/index price data — typically an average or weighted composite drawn from multiple reference sources — rather than relying solely on the venue's own book.
But this defense is not absolute, and understanding its limits matters more than trusting the label. The mark price formula still incorporates a sampling of the perpetual venue's own price alongside the index reference, and the weighting is finite, not infinite. If the venue's own order book is itself thin at the relevant moment — low depth, wide spreads, few resting orders near the touch — a comparatively modest amount of capital can still move the venue's own price input enough to nudge the composite mark price away from what genuine, deep spot markets are showing. The result is a brief but sharp divergence between mark price and true index price, occurring right as leveraged positions are most sensitive to it.
This is structurally the same phenomenon an earlier article in this series described for spot AMM pools: thin liquidity leaves a venue vulnerable to disproportionate price impact from limited capital. Here it recurs one layer up, at the derivatives pricing mechanism rather than the spot swap mechanism, but the underlying vulnerability — depth insufficient to absorb the capital attempting to move it — is the same shape of risk in a different venue.
- Mark price exists specifically to decouple liquidation triggers from a thin, manipulable last-traded price.
- The mark price formula still partly samples the venue's own book, so it is not fully insulated.
- Thin depth on the derivatives venue reproduces the same manipulation vector AMM research already identified at the spot layer.
4. Funding-Rate Farming: The Economics Behind the "Free Yield" Pitch
A funding-rate arbitrage — often marketed informally as "funding farming" — has a simple structural skeleton: buy a unit of the underlying asset on spot, and simultaneously short an equivalent notional amount of the same asset's perpetual contract. If funding rate is positive, longs pay shorts, and the strategy collects that flow while the spot and short-perpetual legs largely offset each other's directional price exposure, leaving a theoretically price-neutral position that harvests funding as its return.
The word "theoretically" is load-bearing. This is not risk-free arbitrage in the way a textbook cash-and-carry trade with guaranteed convergence might be. The short leg is a leveraged derivatives position and carries real liquidation risk of its own: if margin is managed loosely, or if a brief, violent price wick temporarily blows through the position's liquidation price even if the market quickly reverts, the short leg can be forcibly closed at a loss that the spot leg's paper gain does nothing to offset in that moment — the two legs are not perfectly and instantaneously fungible under stress. Funding rate itself is also not stable: it can flip from positive to negative as positioning shifts, turning what was collected income into an ongoing cost the strategy must now pay out of the same position. There is additionally venue and counterparty risk layered on top, independent of the trade's own mechanics.
An earlier article on liquidity mining drew a distinction worth reapplying here: how much of an advertised annualized return is genuine, durable income versus a temporary subsidy tied to current conditions. The same decomposition applies to funding farming. A high advertised annualized yield built from a funding rate pinned at an unusually elevated level during a strongly one-sided bull market is closer to a temporary dividend from that positioning imbalance than a durable, structural fee-like income stream — and it can shrink or invert the moment positioning normalizes or flips.
- The strategy pairs a spot long with a perpetual short to target price-neutral funding capture.
- The short leg retains genuine liquidation risk despite the spot leg's offsetting exposure.
- Advertised annualized yield often mixes durable income with a temporary, positioning-dependent subsidy.
5. Open Interest, Crowding, and the Liquidation Waterfall
Funding rate alone is a snapshot; open interest is what tells a researcher whether that snapshot is a passing blip or a structural buildup. When open interest keeps climbing while funding rate stays pinned at an extreme reading for an extended stretch, the combination signals that one-sided leveraged positioning is not just present but actively accumulating — more capital continuing to pile onto the already-crowded side even as the cost of doing so (the funding payment) keeps rising. That combination is structurally fragile in a specific, mechanical way.
The fragility plays out as a liquidation cascade, sometimes called a liquidation waterfall. An initial adverse price move — which need not be large — pushes the most thinly margined positions on the crowded side to their liquidation price. Those forced closures are themselves market orders that push price further in the same adverse direction, which in turn triggers the next tier of positions sitting just beyond the first liquidation cluster, and so on. The result is a positive feedback loop: liquidations cause price movement, and price movement causes more liquidations, independent of any new information entering the market.
This closely parallels the cascading-liquidation dynamic described in an earlier article on lending-protocol liquidation mechanics, but the trigger chain is different in kind. There, the cascade originated from insufficient collateralization ratios against a falling collateral asset price. Here, the cascade originates from directional crowding in leveraged perpetual positioning — the risk is not that collateral is undervalued, but that too much leveraged exposure sits on one side of a single price axis, clustered at liquidation levels close enough together to trigger each other sequentially.
The practical implication is that no single metric should be read in isolation. Open interest, funding-rate extremity, and the clustering of liquidation price levels together describe one structural picture; any one of them alone is an incomplete and potentially misleading fragment of it.
- Rising open interest alongside pinned extreme funding indicates accumulating, not merely momentary, crowding.
- Liquidation cascades are self-reinforcing: forced closures move price, which triggers further forced closures.
- The trigger differs from lending liquidations — directional leverage crowding, not collateralization shortfall.
6. Common Misreadings and Scope of This Note
Three misreadings recur often enough among researchers and commentators alike to warrant stating plainly. First, treating a funding-rate spike as simply "extremely bullish" or "extremely bearish" without decomposing the interest-rate component from the premium component, as described in Section 2 — a headline number can move for reasons that have little to do with directional crowding. Second, treating funding-rate arbitrage as a risk-free trade, overlooking the short leg's genuine liquidation exposure under sudden volatility and the possibility that the rate itself flips sign mid-position, converting collected income into an ongoing cost, as described in Section 4. Third, reading funding rate in isolation rather than alongside open interest and the clustering of liquidation price levels — an extreme funding reading on its own says less than the same reading paired with climbing open interest and a visible cluster of liquidation levels nearby, as described in Section 5.
Underlying all three is a single habit worth cultivating: funding rate is not a verdict, it is an input. It is one signal among several that, read together, describe how crowded and how fragile current leveraged positioning has become — and crowding is a statement about structure, not a prediction about direction.
This piece has stayed deliberately at the level of abstract mechanism categories. No real exchange, protocol, or specific contract product has been named or implied to operate in any particular way; the numeric examples in Section 2 were invented purely to illustrate a decomposition method and do not describe any observed market condition. Nothing here constitutes investment advice or a recommendation regarding any specific position, strategy, or venue. The aim is narrower and more durable than any single market snapshot: giving a researcher a clearer mechanical vocabulary for what funding-rate divergence actually represents, so that the next time a rate spikes, the instinct is to decompose and cross-check rather than to react to a single number.
- Decompose funding rate into interest and premium components before drawing a directional conclusion.
- Treat funding-rate farming as a leveraged, liquidation-exposed strategy, not a risk-free yield source.
- Read funding rate together with open interest and liquidation clustering, never as a standalone signal.