
1. Why Vault-Model Perpetual DEXs Have No Separate Insurance Fund: The LPs Are the Counterparty
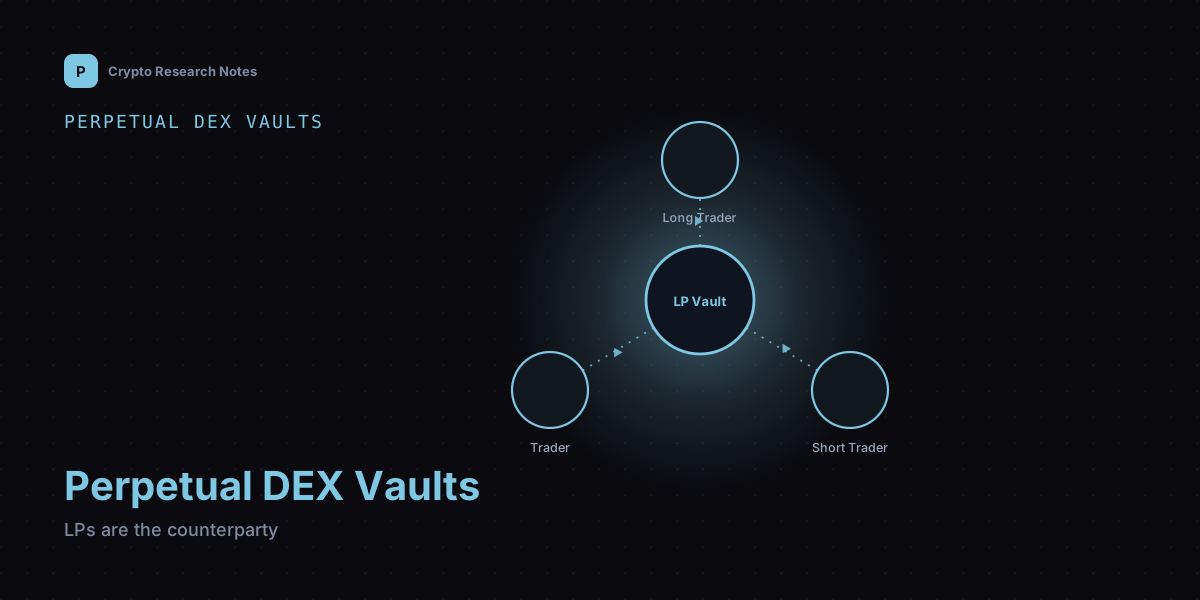
An earlier article in this series traced the liquidation waterfall on a centralized-exchange-style perpetual futures venue: ordinary liquidation, then an insurance fund absorbing shortfalls, then auto-deleveraging as the last resort once that fund runs dry. That entire structure rests on a specific assumption — that there is a separate balance sheet, belonging to "the exchange," sitting between the trader and the rest of the platform's users. A vault-model perpetual DEX removes that middle layer entirely. There is no exchange-operated fund standing between a trader's position and anyone else's capital, because the capital that takes the other side of the trade is the LP vault itself.
Mechanically, this means every open position on the platform has the vault as its direct counterparty. When a trader opens a long, the vault is, in aggregate, implicitly short that same notional exposure; when a trader opens a short, the vault is implicitly long. The vault is not intermediating risk on behalf of some other party, and it is not merely routing the trade to be matched against another trader — it is the other side, full stop. This is a structurally different design from an order-book or peer-to-peer perpetual venue, and it is also different from a traditional constant-product AMM, where a liquidity provider's exposure is to the two pooled assets' relative price, not to a directional bet another market participant is making against them.
The practical consequence is that depositing into this kind of vault is not the same activity as depositing into a conventional AMM pool, even though both are commonly marketed under the umbrella term "liquidity provision." A conventional LP collects swap fees and bears impermanent loss tied to asset-price divergence — a mechanism the liquidity-mining article in this series covered in detail. A vault-model perpetual LP collects trading fees and funding-rate income, but the dominant risk factor is not price divergence between two pooled tokens; it is the net trading result of every counterparty on the platform. A depositor who has not internalized this distinction is likely mispricing the risk being taken on.
- A vault-model perpetual DEX has no separate exchange-owned insurance fund; the LP vault is the direct counterparty to every trade.
- A trader's long implies the vault is implicitly short that exposure, and vice versa — this is structural, not incidental.
- Vault depositors are not passive fee-collectors like conventional AMM LPs; they are structurally underwriting aggregate trader P&L.
2. How Depositor Risk Actually Works: Vault NAV Drops Directly When Traders Are Collectively Profitable
Once the vault is understood as the direct counterparty, the mechanics of depositor risk follow directly. The vault holds a pool of assets, and it issues shares to depositors representing a claim on that pool; each share's net asset value (NAV) rises and falls with the vault's total assets relative to shares outstanding. Trading fees and funding payments collected from traders flow into the vault and push NAV per share up. But when open positions the vault is counterparty to move in the trader's favor, the vault owes that unrealized or realized profit, and it is paid out of the vault's own assets — pushing NAV per share down for every depositor, proportionally, regardless of when they deposited.
The scenario that matters most for a researcher to model is a sustained, one-directional trend rather than a single volatile spike. Short, sharp volatility tends to produce a mix of winning and losing positions on both sides, which is close to a wash for the vault. A prolonged trend is different: if price rises steadily over an extended period, the majority of open interest tends to skew long and stay profitable for the duration of the move, and the vault — structurally short that aggregate exposure — pays out consistently for as long as the trend continues. This is the scenario where NAV drawdown compounds rather than nets out.
The point a researcher should take away is that this is not an edge case or a tail risk sitting off to the side of the vault's normal operation — it is the central mechanism generating the vault's entire return profile. The same exposure that lets the vault earn fee and funding income during range-bound, mean-reverting conditions is precisely what causes it to pay out during a strong directional trend. A depositor is not exposed to an occasional adverse event; they are continuously exposed to the sign and magnitude of aggregate trader P&L, every single day the vault is open for trading.
- Vault NAV per share moves inversely with aggregate trader P&L: traders' net profit is the vault's direct, proportional loss.
- A sustained one-directional trend — not a brief spike — is the scenario that produces the deepest, most persistent NAV drawdown.
- This is not a rare tail event; it is the same core mechanism that generates the vault's fee and funding income in calmer conditions.
3. Verifying Disclosed APY: Does It Net In Payouts to Profitable Traders, or Only Show Fee Income
The liquidity-mining article in this series argued that a headline APY on a conventional pool needs to be decomposed into fee income and emission income before it means anything, because impermanent loss never appears in that number by default. The equivalent — and arguably sharper — question for a vault-model perpetual DEX is whether the displayed APY already nets in the periods when the vault paid out to profitable traders, or whether it reflects only the income side: trading fees and funding-rate receipts, with drawdown periods quietly excluded or measured over a window that happens not to include one.
A true, realized total-return APY has to be calculated from the vault's actual NAV-per-share history: take NAV per share at the start of a period and at the end, and the percentage change over that interval, annualized, is the only number that has genuinely netted in both income and payouts. An APY instead derived by annualizing recent fee and funding accrual — without reference to NAV — will systematically overstate the vault's real return whenever it is quoted from a period that did not include a strong trending phase where the vault was net paying out.
Concretely, a researcher should look for a full historical NAV-per-share chart, ideally spanning at least one complete market cycle that includes both range-bound conditions and at least one strong sustained trend in either direction. A dashboard that shows only a recent, calm, low-volatility window — or that shows fee and funding revenue as a standalone number without ever plotting NAV per share over time — should be treated the same way this series treats any headline yield figure elsewhere: as an unverified claim rather than a total return. The presence or absence of a long NAV history, and whether that history visibly dips during known trending periods, is the single most direct test available.
- A true total-return APY is derived from NAV-per-share change over time, which nets in both trader payouts and fee/funding income.
- An APY built only from recent fee and funding accrual, without NAV history, can look attractive purely by excluding a trending period.
- Demand a full NAV-per-share chart spanning at least one full cycle, including a strong trend, not just a recent calm window.
4. Skew and Hedging: Do the Protocol's Claimed Risk Controls Actually Exist
Because the vault's exposure is a direct function of aggregate positioning, most vault-model protocols describe mechanisms intended to limit how far that exposure can drift from balanced. The most common is a funding-rate skew incentive: when the vault is net short (traders are net long), longs pay a higher funding rate than shorts receive, creating an economic incentive for new positioning to shift back toward balance, and vice versa when the vault is net long. A second common control is a hard position-size cap per market, limiting how large open interest on one side can grow relative to vault capital regardless of funding incentives. A third, less common mechanism is external hedging, where the protocol or an associated entity offsets net vault exposure using positions on other venues.
Each of these claims is verifiable to a different degree, and a researcher should not treat documentation describing them as equivalent to confirmation that they operate. A position-size cap, if genuinely enforced, should be visible as a hard constraint in the deployed contract logic — a maximum open-interest or maximum-skew parameter that can be read directly rather than inferred from a whitepaper description. If that parameter cannot be located on-chain, or if it exists but has been observed to be overridden or adjusted upward under stress rather than held constant, the "cap" is better understood as a design intention than an enforced limit.
Funding-rate skew incentives are easier to verify functionally: the protocol should disclose its current net exposure or skew ratio close to real time, alongside the funding rate itself, so a researcher can check whether elevated funding on the crowded side actually correlates with skew narrowing over subsequent periods, or whether skew persists despite the incentive being in place. External hedging is the hardest of the three to verify from outside the protocol, since it typically depends on off-chain positions on other venues that are not independently auditable; a claim made without disclosed hedge-position data should be weighted as unverifiable, not as a mitigant a researcher can rely on.
- Verify position-size caps as an on-chain, readable contract parameter — not merely a description in documentation.
- Check whether disclosed real-time skew and funding data actually shows incentives narrowing skew over time, or failing to.
- Treat claimed external hedging as unverifiable by default unless the protocol discloses auditable hedge-position data.
5. Stress-Testing a Strong Trend: How Much Could Vault NAV Actually Drop
The auto-deleveraging article in this series modeled a liquidation cascade tranche by tranche, comparing cumulative shortfall against a verified insurance-fund balance. The equivalent exercise for a vault-model perpetual DEX substitutes a different set of inputs — open-interest skew, average leverage, and total vault value — but the underlying discipline is the same: build an order-of-magnitude estimate of drawdown before assuming the vault's stated capital comfortably absorbs a bad scenario.
Consider a fully invented illustrative scenario, with every figure fabricated solely to demonstrate the calculation. A fictional vault holds $50 million in total assets. Open interest across its markets sits at $180 million, split 70/30 in favor of longs — a fictional net skew of roughly $72 million that the vault is implicitly short. Average leverage across long positions is a fictional 8x. Now model a sustained trend: the underlying asset rises 15% over several weeks, a move well within normal volatility but sustained long enough that most long positions remain open and profitable throughout rather than closing early. Applying that 15% move to the $72 million net-short exposure the vault effectively carries (before accounting for any funding income collected along the way, which partially offsets it) produces a fictional payout obligation in the range of $10-11 million — roughly 20% of the vault's total assets in this invented example.
The methodological point is not the specific numbers, which have no relationship to any real protocol, but the inputs a researcher needs to reconstruct this kind of estimate independently: the platform's current open-interest skew (long minus short notional), average leverage on the crowded side, and total vault assets, all of which reputable vault dashboards typically disclose in some form. Running this calculation across a range of plausible trend magnitudes — not just one — gives a rough drawdown curve, and comparing that curve against the vault's actual historical NAV troughs from Section 3 is a useful cross-check on whether the model is in the right order of magnitude.
- Stress-test inputs: open-interest skew, average leverage on the crowded side, and total vault assets.
- All figures in the illustrative example above are invented solely to demonstrate the calculation method, not observed data.
- Cross-check any modeled drawdown estimate against the vault's actual historical NAV troughs for plausibility.
6. Common Misconceptions and Conclusion
Three misconceptions recur often enough with vault-model perpetual DEXs to state directly. The first, covered in Section 1, is treating vault deposit yield as a passive, fee-only return comparable to a standard AMM liquidity pool, when the dominant risk factor is not price divergence between two assets but direct underwriting of aggregate trader profit and loss. The second, covered in Section 3, is accepting a displayed APY at face value without checking whether it is derived from actual NAV-per-share history spanning a full cycle — including a strong trending period — rather than from a recent, calm window of fee and funding income alone. The third, covered in Section 4, is assuming that documented risk controls such as funding-rate skew incentives and position-size caps are actually enforced, rather than verifying them as on-chain parameters and checking whether disclosed skew data shows them working in practice.
Taken together, the five preceding sections build a single line of reasoning: why this design removes the separate insurance-fund layer that centralized-exchange-style perpetuals rely on and replaces it with LP capital as the direct counterparty; why that makes NAV drawdown during a profitable-trader period the vault's core mechanism rather than an edge case; how to verify whether a stated APY has actually netted in that drawdown; how to check whether the protocol's stated skew-management tools are real constraints or just descriptions; and how to build an independent, order-of-magnitude estimate of how far NAV could fall under a sustained trend. None of this produces certainty about any specific vault — it replaces a dashboard's framing with a researcher's own verification trail.
This article discusses abstract mechanism categories common to vault-model perpetual DEX design in general. It does not name, evaluate, or draw conclusions about any real protocol, and every figure used in the illustrative example in Section 5 was invented solely to demonstrate a calculation method. Nothing here constitutes investment advice or a recommendation regarding any specific vault, position, or platform.
- Vault deposit yield includes direct underwriting of trader P&L — it is not a fee-only return like a standard liquidity pool.
- Never accept a displayed APY without checking whether it spans a full cycle, including a strong trending period, via NAV history.
- Verify skew-management mechanisms as enforced on-chain parameters and observable outcomes, not just documented intentions.