
1. Why Incentive Design Is Its Own Research Question
The earlier article in this series on DEX liquidity research focused on a mechanical question: given an automated market maker, how do you verify pool depth, price impact, and the ways thin liquidity gets exploited around MEV. That article assumed liquidity was already sitting in the pool and asked how it behaves once trades hit it. This article asks a different, prior question: why does that capital show up in the pool at all? Liquidity providers (LPs) are not depositing assets out of goodwill — they are underwriting price risk and opportunity cost, and someone has to compensate them for it. Understanding that compensation layer, separate from the pricing mechanics layer, is its own research discipline.
It also sits next to, but is distinct from, the lending-liquidation article's focus on incentivizing liquidators. Liquidator incentives are a narrow bounty problem: pay enough to guarantee someone closes a bad position quickly. LP incentive design is broader and messier — it has to attract capital continuously, over long time horizons, against competing pools that may pay more. That makes it a design problem with its own failure modes: incentives that look generous on a dashboard but are economically unsustainable, or that attract capital that vanishes the moment terms change.
As with the rest of this series, the scope here is methodology, not any specific protocol. Every numeric example below is invented purely to illustrate a mechanism category — a "reward token," a "blended APY," a "price-divergence scenario" — not a claim about any real pool, project, or token. The goal is a repeatable framework a researcher can apply to any liquidity-mining program, not a verdict on one.
- Prior article: DEX liquidity mechanics — how AMM pricing and depth work, and how to verify them.
- Prior article: lending liquidation mechanics — how liquidator incentives are structured.
- This article: why LPs participate at all, and how to evaluate whether that participation is durable.
2. Two Sources of Yield: Fees vs. Emissions
A liquidity-mining dashboard almost always shows a single blended APY number, but that number is typically the sum of two economically unrelated things. The first is real yield: a share of the trading fees the pool actually collects from swaps, funded directly by genuine trading volume. The second is emission-reward yield: additional tokens minted and distributed by the protocol as an incentive, funded by inflation of the reward token's supply rather than by any trade that happened in the pool. A researcher's first task with any mining program is to decompose the blended figure into these two components before treating it as meaningful.
Consider a purely fictional example, invented only to illustrate the split: a pool displays a "42% APY." Digging into the fee-accrual data shows the pool generates fee revenue equivalent to roughly 6% annualized on deposited capital — this is the real-yield component, tied to actual swap volume and collectible regardless of what happens to the reward token's price. The remaining 36% is paid out in newly emitted reward tokens, valued at their current market price at the moment the dashboard calculated the figure. Those two slices behave completely differently under stress: fee revenue persists as long as people trade in the pool, while emission-reward value depends entirely on the reward token holding its price, which, as later sections discuss, emissions themselves put pressure on.
- Real yield: derived from trading fees, tied to actual usage, does not depend on a token's price holding up.
- Emission yield: derived from newly minted reward tokens, funded by inflation, valued at a snapshot price.
- A single blended APY conceals which of the two a researcher is actually being paid in.
3. Verifying Impermanent Loss Against the Headline Number
Impermanent loss (IL) is the gap between what an LP's position is worth on withdrawal and what the same capital would be worth simply held outside the pool, and it arises whenever the relative price of the two pooled assets diverges after deposit. Crucially, IL never appears in the headline APY figure — that number describes fee and emission income, not principal-value change. A pool can advertise a high APY while an LP quietly loses more in IL than the rewards ever pay back. Verifying this requires calculating IL independently for a plausible price-divergence scenario, not assuming the advertised APY already accounts for it.
Take a fictional, illustrative case: an LP deposits into a two-asset pool split evenly by value. Over some period, one asset's price doubles relative to the other. Standard constant-product IL math shows the LP's withdrawn value would be roughly 5.7% lower than if the two assets had simply been held separately, unpooled. If the pool's emission-reward APY over that same period paid out the equivalent of 8% of deposited value, the rewards more than offset the IL, and the position was net positive. If the reward APY had instead been 3%, the LP would have been better off never depositing at all, despite the pool's dashboard showing a positive-looking number throughout. The point is not the specific figures — again, entirely invented for illustration — but the discipline: IL and reward APY must be compared directly, for the specific divergence scenario a researcher considers plausible, not assumed to cancel out.
- IL is a function of price divergence between pooled assets, independent of any reward program.
- IL does not appear anywhere in a displayed APY figure.
- Net outcome = reward income (fees + emissions) minus IL, calculated for a specific scenario, not assumed.
4. Mercenary Capital and the Farm-and-Dump Pattern
"Mercenary capital" describes liquidity that is present in a pool only because of an attractive emission rate, with no loyalty to the pool, the protocol, or the trading pair itself. This capital arrives quickly when a new mining program launches with high rewards and leaves just as quickly when the emission rate is cut or a better-paying pool opens up elsewhere. A closely related behavior is the "farm and dump" pattern: participants claim reward tokens and sell them immediately rather than holding them, since their only interest was the yield, not the reward token's long-term value. Aggregated across many LPs, this creates persistent sell pressure on the reward token that has nothing to do with the protocol's fundamentals.
Both patterns leave on-chain traces a researcher can look for. Reward-claim transactions followed within a short window by a transfer to an exchange deposit address, repeated across many wallets, is a signature of farm-and-dump behavior. Sharp pool-TVL (total value locked) declines that line up closely with an announced emission-rate cut, rather than with any change in trading activity, is a signature of mercenary capital rather than fee-driven, sticky liquidity. Distinguishing the two matters because a pool full of mercenary capital can look identical to a genuinely trusted pool on a simple TVL chart, while behaving completely differently the moment incentives change.
- Mercenary capital: liquidity present only for reward yield, absent any loyalty to the pool.
- Farm and dump: reward tokens claimed and sold immediately, creating steady sell pressure.
- On-chain tell: claim-to-exchange transfer patterns and TVL moves that track emission-rate changes rather than volume.
5. Emission Dilution: Reverse-Engineering a "Real" APY
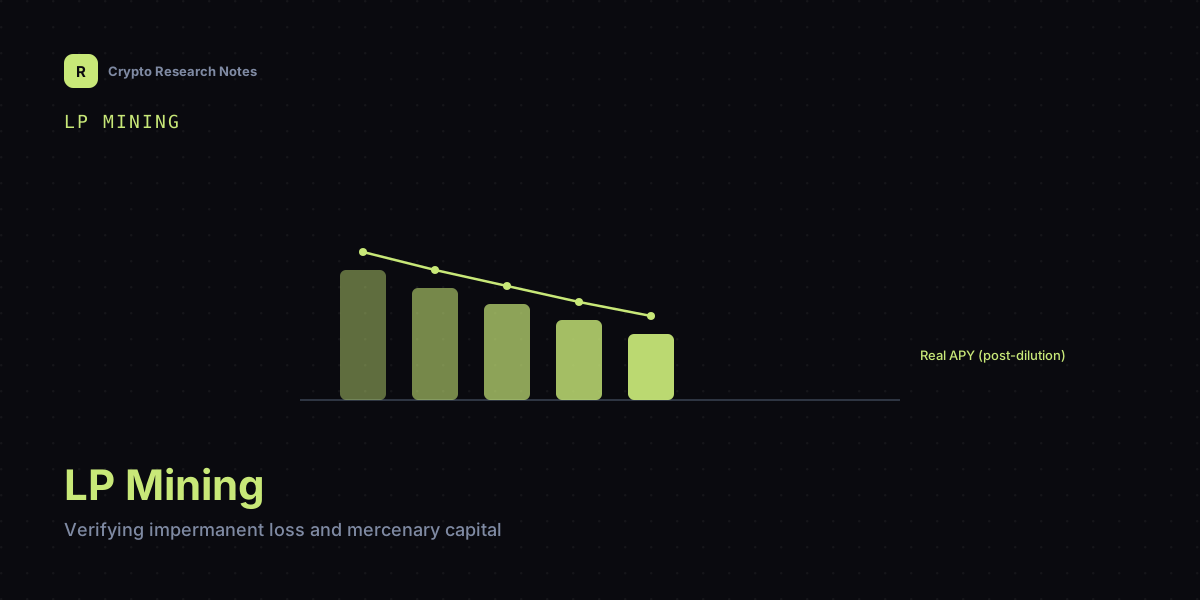
An advertised reward APY is almost always a single-point-in-time calculation: it takes the current emission rate, multiplies it by the reward token's price at that moment, and annualizes it. What it does not capture is that continuous emission expands the reward token's circulating supply over time, and, all else equal, expanding supply puts downward pressure on that token's own price. This is the same supply-schedule logic the tokenomics article in this series applies to a project's overall token — unlock and emission schedules matter for valuation — applied here specifically to a mining reward token's price trajectory rather than the main governance token.
A researcher trying to estimate a durable, long-term APY rather than a day-one snapshot should therefore model the emission schedule forward: purely for illustration, say a reward token emits at a constant rate that grows circulating supply by 15% over a year, and historical patterns for comparable reward tokens under similar dilution suggest a roughly proportional price decline absent new demand. A day-one advertised APY of 40% might, once the reward token's price is projected to soften under that supply growth, be closer to a 25-28% realized APY by the end of the period — still potentially attractive, but materially different from the headline figure, and worth stress-testing before treating the initial number as a stable expectation.
- Advertised APY = snapshot calculation at current reward-token price, not a forward projection.
- Continuous emission grows supply, which tends to pressure the reward token's price downward over time.
- Ties to the tokenomics article's method: model the emission/vesting schedule forward before trusting a yield figure.
6. Common Misconceptions and Conclusion
A few recurring misconceptions show up when researchers evaluate liquidity-mining programs. First, treating a headline blended APY as a stable, sustainable figure, when it may be almost entirely emission-funded and subject to both reward cuts and reward-token price decay. Second, reading rapid TVL growth in a new pool as evidence of genuine user trust, when it may simply reflect mercenary capital chasing a temporarily generous emission rate, with no underlying commitment to stay. Third, skipping an explicit impermanent-loss calculation on the assumption that "the APY looks high enough to cover it" — a judgment that is only valid once IL has actually been computed for a specific price-divergence scenario, not assumed away.
Pulled together, this article's framework sits alongside the two it builds on: the DEX-liquidity article's methods verify that a pool's depth and pricing behave as expected once capital is there; this article asks whether the capital should be expected to stay, by decomposing yield into fee and emission components, checking that IL is actually covered, watching for mercenary and farm-and-dump behavior, and discounting headline APY for emission-driven dilution going forward. None of this amounts to a verdict on any specific pool or protocol — every figure used here was invented solely to illustrate a mechanism category. The purpose is a repeatable checklist a researcher can apply to any liquidity-mining program encountered in the wild, not investment guidance for any of them.
- Misconception: a blended headline APY is a sustainable, forward-looking number.
- Misconception: fast TVL growth signals trust rather than emission-chasing.
- Misconception: assuming rewards cover impermanent loss without calculating it directly.